
Multiple arbitrage in digital businesses depends on more than buying at one multiple and selling at a higher one. The earnings base can shrink after replacement management, central overhead and integration costs. Model that bridge before assuming a larger group will produce a profitable exit.
Build an acquisition schedule, consolidated operating model and exit-proceeds bridge. Gather each asset’s financial records, owner workload, operating dependencies, funding terms and integration plan. The example below is entirely hypothetical. Its multiples are invented assumptions, not market observations, buyer commitments or forecasts.
Define the acquisition and exit earnings bases
Write down what each acquisition multiple measures. Price divided by annual profit is different from price divided by monthly profit, annual revenue or forecast EBITDA. Identify the period, currency, accounting basis and normalization adjustments. Keep the same definition when comparing an entry and exit assumption.
Assume two fictional assets each earn $50,000 annually before the new central costs in this example. The buyer pays three times those annual earnings for each asset: $150,000 apiece, or $300,000 total. No inventory adjustment, debt or transaction cost is included yet.
| Hypothetical acquisition | Annual earnings | Entry multiple | Price |
|---|---|---|---|
| Asset A | $50,000 | 3x annual earnings | $150,000 |
| Asset B | $50,000 | 3x annual earnings | $150,000 |
| Combined starting position | $100,000 | Same stated basis | $300,000 |
Those multiples are annual, not monthly. Do not compare the 3x assumption with a marketplace figure quoted in months without conversion and an identical earnings definition. Revenue multiples cannot be converted to profit multiples merely by changing the time unit.
Empire Flippers’ public valuation tool illustrates an estimate route with business-model-specific inputs. It does not establish that these fictional assets could be bought at 3x or sold at another chosen multiple. No calculator submission was performed for this guide.
Separate operating improvement from a repricing assumption
Build a value bridge with distinct sources. Operating improvement changes sustainable earnings through supported changes in sales, costs or service delivery. Repricing changes the multiple a future buyer is assumed to pay. The first does not guarantee the second, and neither is established merely by combining ownership.
For each proposed improvement, state the action, responsible person, investment, expected mechanism and evidence required. A shared report can improve oversight without immediately reducing cost. A combined support team can increase workload before it becomes more efficient.
Identify any cost removed from the model and ask who performs the work afterward. If the founder continues doing it unpaid, the economic burden remains. If a contractor replaces the founder, price the contractor and the supervision that remains with the owner.
FE International’s diligence framework provides context for examining operating, technical and other dependencies. Apply those questions to the proposed group. A larger combined business may still depend on one developer, channel or customer and therefore fail to offer the stronger operating proposition assumed at exit.
Keep a scenario containing no improvement and no multiple expansion. This exposes whether the plan needs a future buyer to accept a valuation that has not been demonstrated. An investment thesis can include uncertainty, but it should not disguise uncertainty as achieved value.
Include central costs, debt and integration investment
Add $30,000 of annual central overhead to the fictional group. Assume this is incremental and was not already deducted from the two $50,000 earnings figures. Consolidated annual earnings fall from $100,000 to $70,000. If a cost already existed in the asset accounts, avoid deducting it twice.
Central overhead might include management, reporting or shared services, but the real categories and amounts need evidence. Separate a one-time migration bill from continuing expense. Both affect economics, yet they enter the earnings and cash bridges differently.
Create a uses schedule for purchase prices, diligence, advisers, integration, working capital and reserve. Then identify available funding sources. BDC’s acquisition financing guide explains that financing layers have different priorities and conditions. Its discussion does not provide terms for this fictional acquisition.
Track debt separately from enterprise-level valuation. An assumed business sale value is not automatically equity cash received by the owner. Debt repayment, fees, retained obligations and other closing adjustments can reduce proceeds. Tax effects require qualified advice and should not be filled with an invented universal percentage.
Also track operating cash between entry and exit. Distributions, additional contributions and retained earnings affect the owner’s full investment result. Comparing purchase price with exit value alone omits that holding-period history, while adding operating cash twice overstates it.
Stress the exit multiple and timing
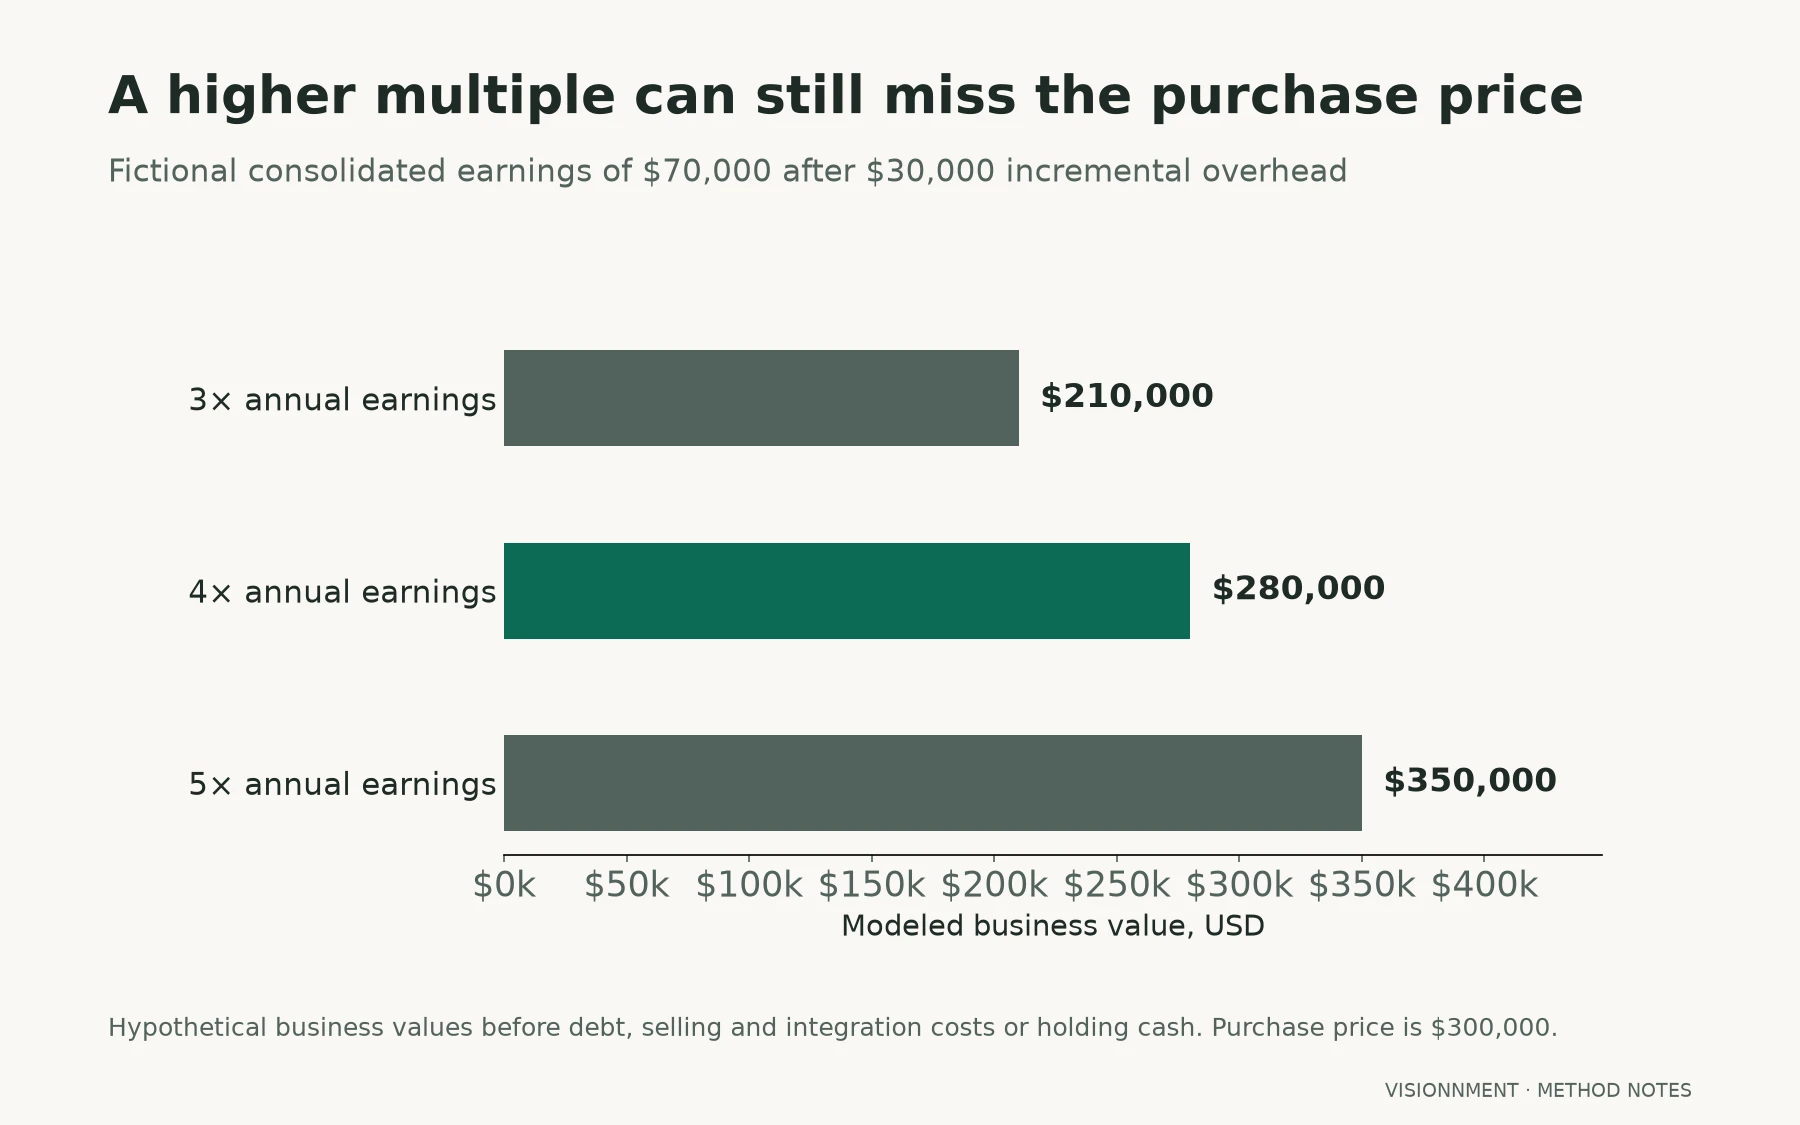
Apply a hypothetical 4x annual-earnings exit multiple to the $70,000 consolidated earnings. The result is $280,000 before selling costs, debt or other adjustments. That is $20,000 below the $300,000 acquisition price, despite an exit multiple higher than the entry multiple.
| Exit assumption | Earnings base | Gross modeled value |
|---|---|---|
| 3x annual earnings | $70,000 | $210,000 |
| 4x annual earnings | $70,000 | $280,000 |
| 5x annual earnings | $70,000 | $350,000 |
All three are invented scenarios. They are not a market range or probabilities. Even the $350,000 scenario does not establish profit after integration, financing, selling costs and the holding-period cash history.
Calculate the limited break-even multiple explicitly. Recovering $300,000 from $70,000 of annual earnings requires about 4.29x before any further costs. That figure is a mathematical threshold under this model, not evidence that a buyer will pay it.
Now change timing. A delayed exit can require more management, software, debt payments and capital. It can also generate operating receipts, which must be included consistently. Do not assume the direction of the net effect without building the dated cash schedule.
Stress the earnings base as well as the multiple. A customer loss, provider problem or unsupported integration can reduce sustainable earnings. Applying a high multiple to a weakened base may still produce a poor outcome. Keep the specific operating cause visible rather than showing only a colorful sensitivity table.
Test buyer fit and the evidence for a larger asset
Describe the future buyer proposition in concrete terms. Does the group offer reliable management, understandable reporting, defensible customer relationships and supported transfer routes? Which evidence would a buyer need to verify that proposition? Bigger revenue alone does not answer those questions.
Review the integration perimeter. Combining brands or systems may remove value customers relied on. Preserving separate operation may retain quality while leaving more central work than planned. Document the actual trade-off instead of assuming consolidation creates a premium.
Examine shared dependencies. Two assets relying on the same acquisition channel are not automatically diversified. One manager covering both businesses can become a bottleneck. The portfolio capacity audit helps test whether the operating plan fits available people and capital.
Keep any comparable transactions within their stated scope. Match financial denominator, period, size, business model and consideration structure. A report covering larger SaaS businesses does not establish the exit multiple for a mixed content-and-ecommerce group.
If buyer interest remains unobserved, say so. A model can show the value required for a target outcome, but that is different from demonstrated demand. Do not fill the gap with an anonymous case study or an assumed broker premium.
Present a bridge that another reviewer can change without altering hidden formulas: asset earnings, incremental central expense, consolidated earnings, assumed multiple and deductions from gross value. Keep the commercial assumptions visible even when a spreadsheet performs the arithmetic automatically.
Compare consolidated proceeds with standalone ownership
Model the alternative of operating the assets separately using consistent assumptions. Include the management and maintenance each route requires, any shared costs that genuinely remain, and the relevant funding. Avoid giving the consolidated case all proposed improvements while freezing the standalone case at an artificially weak baseline.
Compare proceeds after the same categories of cost and obligation. If one route assumes separate sales, include its actual estimated selling and transition costs. If no supported estimate exists, show the unknown and explain how much it matters to the decision.
In the fictional example, the apparent arbitrage disappears because $30,000 of central overhead changes the earnings base. The 4x exit produces $280,000 before further costs. That is the supported calculation; the owner’s final return remains unknown without the rest of the cash and proceeds bridge.
For readers considering an assisted purchase route, the Empire Flippers buying-process guide explains its surrounding stages. The immediate investment task is to reconcile entry earnings, continuing costs and conditional exit assumptions. A higher modeled multiple is a hypothesis about a future buyer, not a substitute for a fundable operating business.