
Digital M&A market reports become useful when you preserve what their figures actually measure. A revenue multiple for one SaaS sample and a profit multiple for a broker’s ecommerce transactions cannot be averaged into a general digital-business benchmark. Publisher, sample, period, denominator and deal status belong beside every number.
Build a report-comparison sheet before using market commentary in an acquisition model. Gather the original reports, methodology notes, tables and definitions. The output is a dated underwriting input with an explicit scope limit. This guide does not present a market forecast or independently verified transaction dataset.
Identify publisher, sample, period and inclusion rules
Start with the original publication, not a social post summarizing it. Record the publisher, publication date, data period, geography, business model, size range and inclusion criteria. Note whether the publisher advises, lists, buys or finances the transactions it describes. Commercial involvement does not make the information useless, but it shapes the sample.
For example, Empire Flippers’ 2026 industry report is a broker-published source. Its title year should not be assumed to describe the period of every table. Read the methodology and table labels before assigning a figure to a particular year or business model.
Identify what was excluded. A broker’s sold sample may omit rejected businesses, unsold listings, private transactions and assets outside its mandate. A report about larger SaaS companies may offer little direct evidence about a small owner-operated content site. Preserve those differences rather than adding a generic caveat at the end.
Record sample size where disclosed and mark it unknown where it is not. Do not invent a number of transactions to make a report appear more robust. If the same deal can appear in multiple sources, avoid treating the reports as independent observations without evidence.
Separate listings, closed deals and market-wide claims
An asking price records a seller’s position at a time. A closed deal records a negotiated transaction, subject to whatever consideration definition the source uses. Neither automatically represents the whole market. Keep listing and sale observations in separate columns.
Ask what the reported price includes. Cash at closing, deferred consideration, earnouts, stock, inventory and assumed liabilities can create different economic values. If the source does not explain the treatment, preserve that uncertainty. Do not call the headline price money already collected by the seller.
Flippa’s H1 2026 insights page is another publisher-specific report route. Inspect the actual report’s scope before comparing it with a broker’s closed transactions. A larger number of marketplace observations does not automatically create a comparable sold sample.
Separate descriptive statistics from forward-looking commentary. A publisher may explain its view of buyer appetite or future conditions alongside historical data. Attribute that view as the publisher’s analysis. Do not restate it as an observed future outcome or an independently established forecast.
Community accounts can suggest questions worth investigating, but they do not fill missing transaction records. An anonymous successful purchase or failed listing cannot establish the distribution of outcomes for all buyers. Keep anecdotes out of the numerical benchmark unless their inclusion is part of a defensible documented method.
Normalize earnings, revenue and multiple periods
Write each multiple as a formula: price divided by the exact financial denominator. Identify revenue, gross profit, seller discretionary earnings, EBITDA or another measure. Preserve whether the denominator is historical, forecast, annualized from a short period or normalized through adjustments.
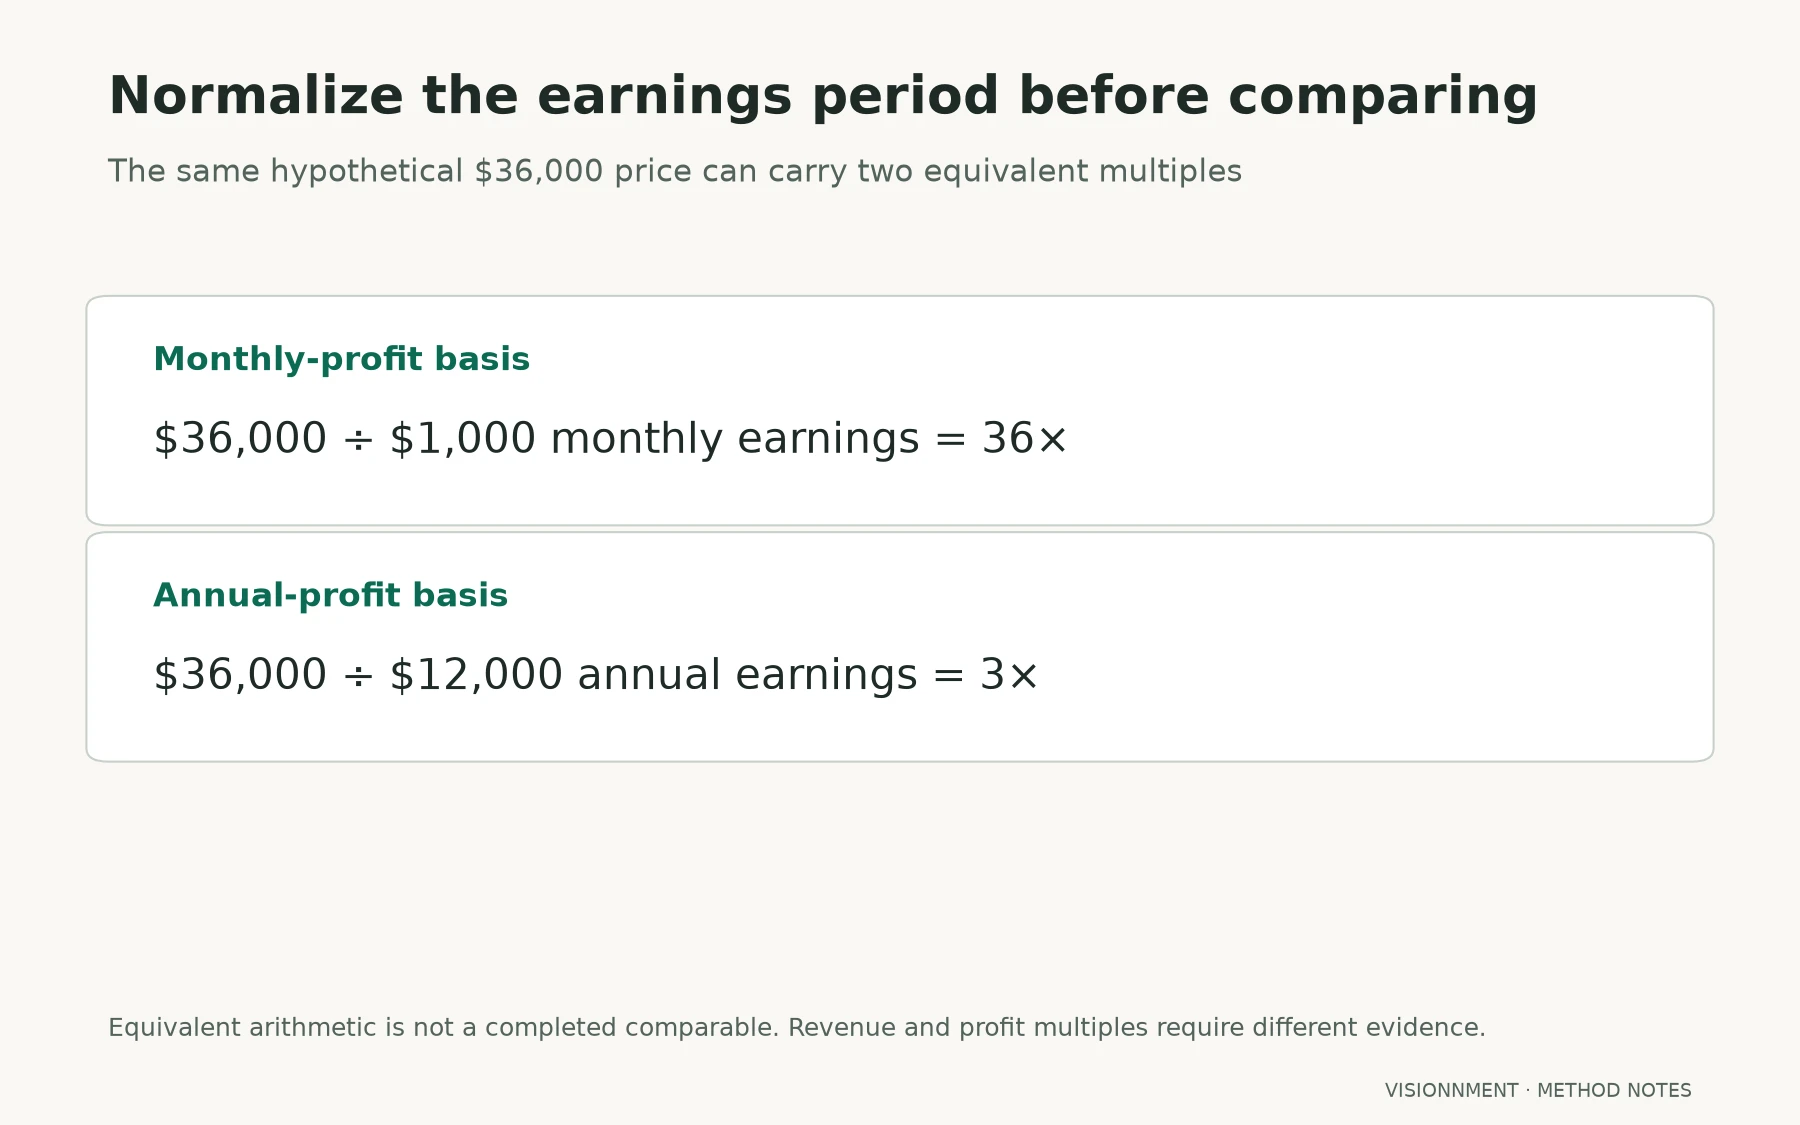
Monthly and annual multiples are different scales. If the same stable earnings basis is $1,000 per month or $12,000 annually, a $36,000 price equals 36 times monthly earnings or three times annual earnings. This arithmetic does not validate the earnings or create a market comparable.
Revenue and profit multiples cannot be converted merely by changing the period. You need a supported margin and consistent accounting boundary. A revenue multiple for a high-margin subscription product cannot be treated as a profit multiple for a stock-intensive ecommerce business.
The valuation methods guide develops these denominator choices. Use it before importing a reported multiple into a deal model. A polished report table does not correct an unsupported earnings base.
Preserve mean and median as distinct statistics. A mean is affected by all included values; a median identifies the middle observation under its definition. Converting the unit does not make them interchangeable, and averaging one mean with another report’s median does not produce a meaningful combined statistic.
Account for model mix and financing assumptions
Compare like business models at similar size and operating boundaries where the evidence permits. Content, SaaS, ecommerce and service businesses have different cost structures, customer relationships and transfer dependencies. A change in the mixture of sold businesses can move an aggregate multiple without proving that every category repriced.
Ask whether the report separates owner-operated and managed businesses. Replacement labor can materially alter the earnings available to a new owner. A seller’s discretionary earnings figure and an earnings measure after management costs describe different operating propositions.
BDC’s acquisition financing guide explains that capital stacks can include sources with different priorities and repayment conditions. A reported price does not show whether a particular buyer can finance it or sustain the resulting cash demands.
Keep price and structure together. Deferred payments or contingent consideration can shift risk between parties. Do not compare headline prices as if all consideration were unconditional cash at closing. Where the report lacks the structure, mark the limitation instead of estimating it silently.
FE International’s SaaS diligence framework provides an adviser’s acquisition context. Its discussion should not be treated as a transaction-matched dataset for a different model or size range, and promotional market conclusions require attribution.
Compare contradictory reports at their actual scope
Use a side-by-side sheet before deciding that two reports disagree. The worked example below describes hypothetical report fields; it does not reproduce actual market figures.
| Field | Report A design | Report B design |
|---|---|---|
| Business sample | Selected SaaS companies | Broker’s FBA sold sample |
| Statistic | Median | Mean |
| Financial base | Annual revenue | Annual profit |
| Observation | Stated SaaS sample under its method | Closed transactions under broker method |
| Valid combined average | None established | None established |
The two figures may both be accurate within their own definitions and still answer different questions. There is no useful combined multiple without underlying comparable data and a defensible method. Refusing to average them is a substantive analytical result.
Check the periods next. A publication released in 2026 may contain transactions from an earlier year, while another covers only six months. A seasonal or model-mix change can affect the comparison. Aligning the publication dates alone does not align the underlying observations.
If definitions remain incomplete, contact the publisher through an appropriate process or retain the unknown. Do not reverse-engineer a missing method from a convenient result. A narrower supported conclusion is more useful than a precise-looking number built on guessed definitions.
Consider weighting only when the underlying observations are compatible and available. Two report averages cannot be combined responsibly by giving each report equal weight when their sample sizes, definitions and included deals differ. Even a sample-size-weighted calculation can be invalid if one report duplicates transactions in the other.
For the hypothetical SaaS and FBA comparison, the next useful step is to find a closer comparable within each original sample, not to manufacture a blended digital multiple. If no such comparable is disclosed, preserve that limit. Asset-specific underwriting can proceed with explicit scenarios while the market input remains unresolved.
Keep a dated underwriting input record
For every report figure used in a memo, save the original source, page or table, data period, metric definition, sample scope and intended use. Add a sentence explaining what it does not support. Another reviewer should be able to reproduce the interpretation without finding the report again from scratch.
Distinguish market context from asset-specific evidence. A report may help frame questions about price, buyer expectations or model risk. It cannot verify a target’s revenue, customer retention, provider permissions or maintainability. Those need their own diligence.
Empire Flippers’ public valuation tool provides an estimate route, which is different again from a report statistic or a negotiated closing value. Do not describe a tool output as a confirmed comparable sale. No calculator submission was performed for this guide.
Carry the dated input into the digital-business investment memo with the relevant limits intact. Revisit it when the source, target business or financing assumptions change. The goal is an underwriting decision whose evidence can be inspected, without turning a selected historical sample into a promise about the next asset.